How To Improve the ROI of Customer Experience

Table of Contents
As a CX professional, you know that business success depends on the experience of your customers. Unfortunately, customer experience is, by definition, subjective. The impact of CX on business performance is hard to measure, so you’d be forgiven for thinking it’s impossible to track the ROI of customer experience.
Connecting customer experience metrics with financial results can be more guesswork than science. Numerous studies highlight the relationship between customer experience and financial performance. There is, however, no single framework.
Because growth is a top priority for senior executives, you must show how your customer experience program contributes to growth. Otherwise, it’s headed for the chopping board.
We’ll reveal Key Performance Indicators (KPIs) for measuring customer experience. We’ll also reveal how they’re used to improve ROI.
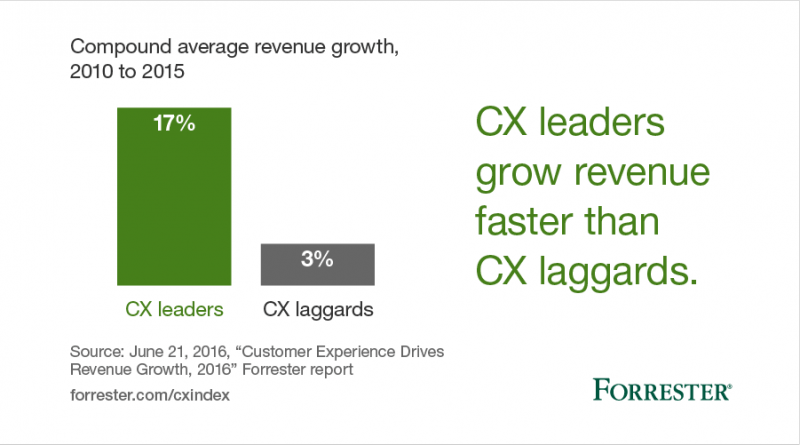
Source: https://go.forrester.com/blogs/16-06-21-customer_experience_drives_revenue_growth_2016/
How to measure the ROI of customer experience
You may already track key voice of customer metrics. These include your Net Promoter Score (NPS), Customer Effort Score (CES) and Customer Satisfaction Score (CSAT). But their impact on the bottom line is not always obvious.
The following key performance indicators help measure the impact of your customer experience platform:
Customer Lifetime Value (CLV)
Your Customer Lifetime Value is the most obvious indicator of the success of your customer experience program. It shows the total revenue your organisation earns on average from each customer during the lifetime of the relationship:
CLV = average order value x number of transactions X retention period
With its direct relationship to profitability, CLV helps you make important sales, marketing, and customer support decisions affecting the customer experience.
There are significant financial benefits to improving the customer experience:
- Forrester reports that customer experience leaders grow 5x faster than their counterparts.
- Bain & Company reports customer experience leaders achieve CLVs up to 14x greater than their counterparts.
- And it costs 5x as much to gain a new customer as it does to keep an existing one. While an increase of 5% in customer retention can generate up to 95% more profits.
Customer Churn Rate
We’ve just seen how a small increase in customer retention can have a significant impact on profitability. It’s therefore good practice to monitor your customer churn rate.
Unhappy customers are quick to leave. But they equally reward a positive experience with continued loyalty. Not to mention that a negative customer experience costs time and money to rectify. And dissatisfied customers spread a negative narrative about your brand.
Churn rate is the percentage of customers lost within a given time frame:
Churn Rate = (number of customers churned this time period / number of customers at the start of this time period) X 100
Tracking your churn rate helps you make adjustments to your customer journey. For example, if high numbers of customers are leaving after trying your product, you may have usability issues.
Customer journeys have been shown to have significantly more impact on revenue compared to customer touch points.
Customer Acquisition Cost (CAC)
Your Customer Acquisition Cost is normally tracked alongside the customer churn rate and CLV. It’s the average cost of acquiring a customer. It includes sales and marketing overheads associated with converting that customer:
CAC = (total cost of sales and marketing) / (number of customers acquired)
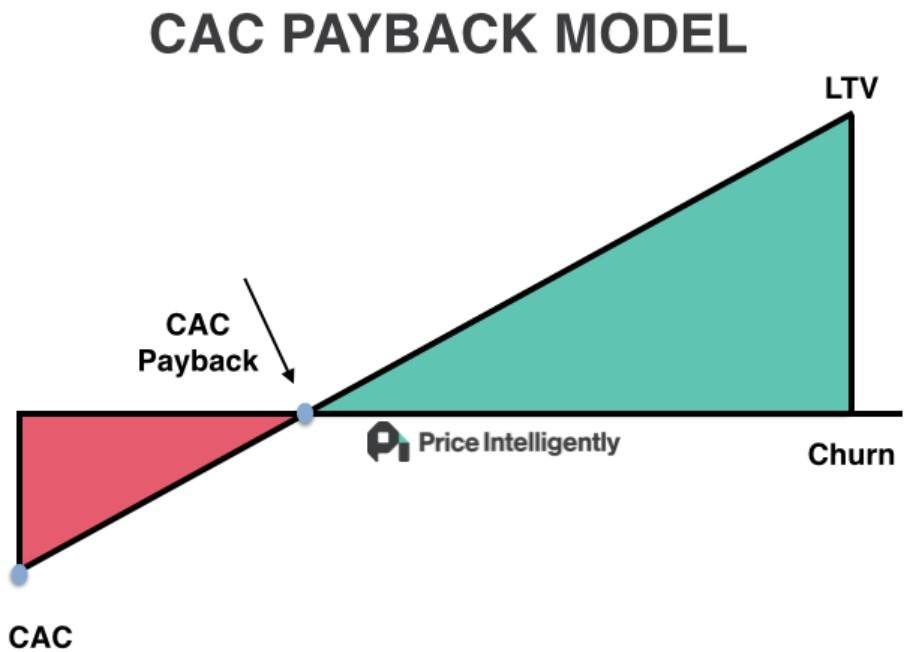
Source: https://www.profitwell.com/recur/all/calculate-and-reduce-cac
You can use a customer service metric calculator to calculate your key performance metrics.
Cost To Serve
The Cost To Serve reveals the costs that go into servicing a customer or producing a product. It provides a focus to show profitability per customer.
It reflects the costs associated with your customer experience program (e.g. customer support, quality assurance). It also highlights opportunities for improvements in the customer journey.
Use analytics software to calculate your costs to serve.
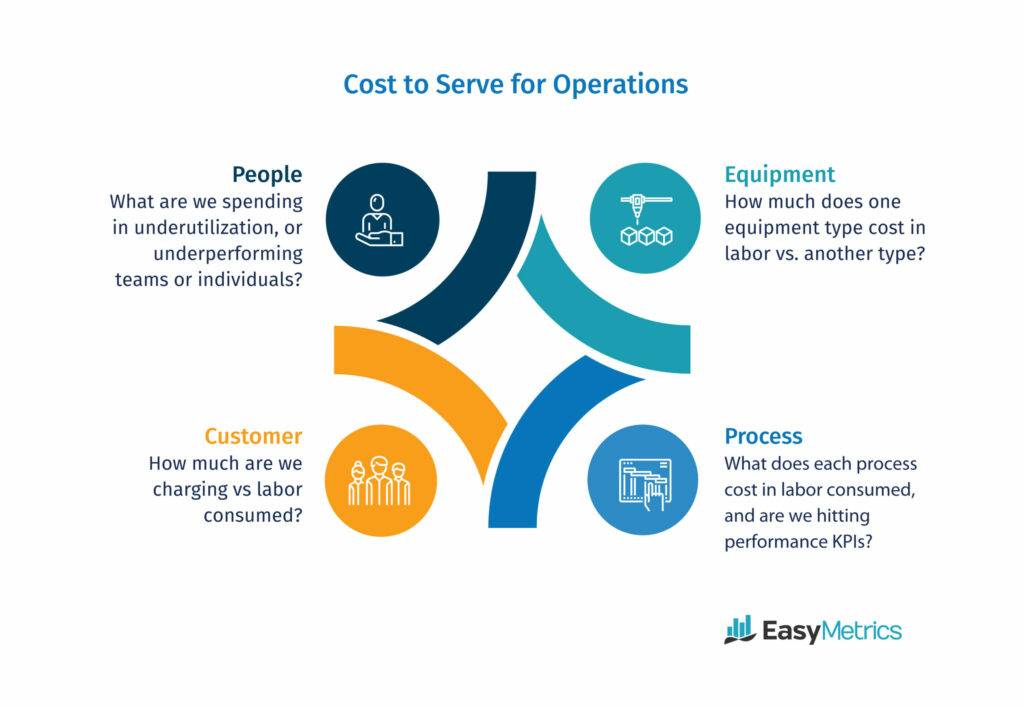
Source: EasyMetrics
How to improve the ROI of customer experience
Key performance indicators are only useful where they show returns on investment.
Once you’ve decided on which to track, it’s time to dig into your analytics. Go through the following four steps to improve customer experience ROI:
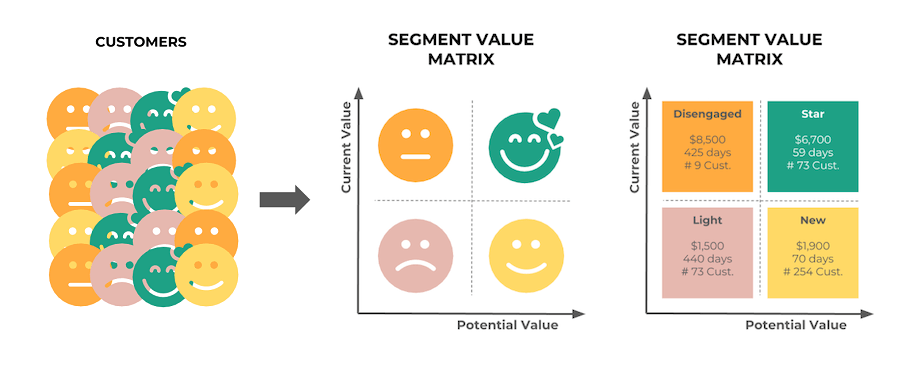
1. Segment your customers
Use targeted customer satisfaction survey questions to identify your various customer segments, allowing you to link customer experience metrics to behaviours. This also helps spot opportunities to increase revenue.
There are many ways to segment your customers: Along personal characteristics for example. Such as age, gender or geography. Or along behavioural characteristics. Such as purchases made, benefits sought or timings of purchases.
2. Allocate data to your customer segments
You’ve already pinpointed various data sources when thinking about your KPIs. You don’t have to limit yourself to internal data sources. You can also reference third-party data sources. In fact, this will give a more rounded picture to your analysis.
Various data sources include:
- Customer feedback surveys
- Social media conversations
- Product usage reports
- Consumer reviews
- Industry benchmark reports
3. Compare qualitative and quantitative data
Examine your various customer segments, what they bought and where. Map this information to your customer journey. Identify trends (e.g. high churn rates), roadblocks, and highlight unique behaviours (e.g. customers talking about a specific feature).
Use text analytics software to help you analyse qualitative data. This data can come from support tickets, feedback surveys, customer conversations, consumer reviews, and other sources,
4. Apply your analysis
Take advantage of what you’ve learned to personalise the customer experience. Look for customer segments where you can make the most impact. For example, high-value segments but with a high churn rate.
Guide each customer segment through their journey as you remove roadblocks to purchasing. Keep monitoring your results. Use quantitative data to show financial results. Use qualitative data to increase customer delight.
This is where business focused KPIs like your Customer Lifetime Value and Customer Acquisition Cost prove their worth in showing ROI.
Key takeaway
To show the value of your customer experience program, you need to move beyond voice of customer metrics and think about how they relate to objective business outcomes.
Be creative. Think about how business metrics such as Customer Lifetime Value, Customer Acquisition Cost and even Cost To Serve help build a case for your customer experience program.
Dig deep into your analytics: CRM, social media conversations, support tickets, and other sources of data to build a complete picture. This puts you in a strong position to show customer experience ROI.

Tom Sutton
Co-founder, TRACX
Tom is the co-founder of TRACX, a no-code marketing platform that allows local business owners to collect customer feedback and create engaging marketing campaigns. With over 17 years of experience in entrepreneurship, product development, and marketing for businesses large and small, Tom is currently responsible for developing product and marketing strategies for TRACX.